Chrome console and iFrames
Sometimes you are debugging an issue using the Chrome developer tools and you are happily executing some statements in the console to make sure everything is where it should be.
Once in a while you might try to get an element that you know is being rendered but the selector returns nothing:
1
| |
However you can see that the element exists on the page and inspecting via the elements tab (CTRL+SHIFT+C) shows that it does in fact have the expected id. Strange.
Scratching your head you notice that this element belongs to an iFrame. Luckily Chrome always seems to have our back in situations like this.
Chrome actually has an option to set which iFrame the console is currently evaluated against. If you go to the console tab at the bottom you’ll see a dropdown named top frame:
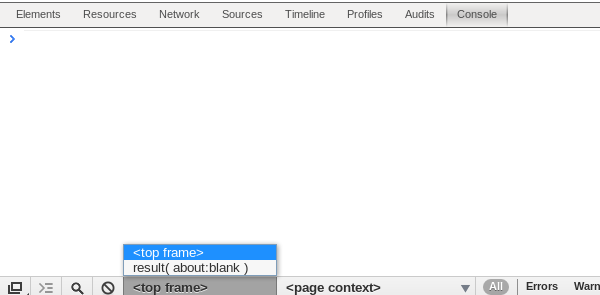
Changing it to the iFrame you want to debug against will allow you to access all the dom elements in the console as needed!
Bonus
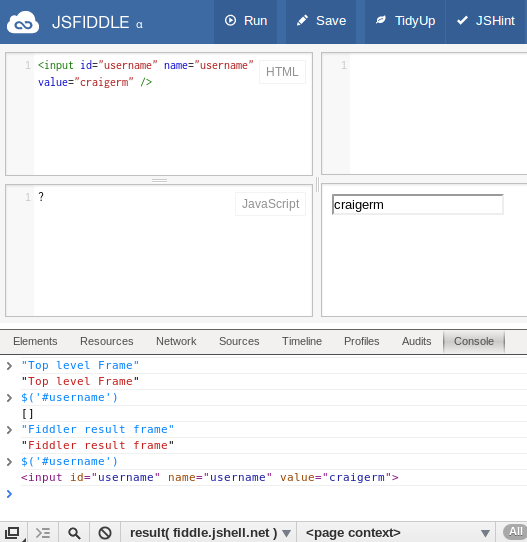
Sometimes someone will send you a code sample via jsFiddle (or maybe you are investigating a stack overflow question). Since the code is run in an iFrame you’ll need to change the console’s frame in order to interact with the elements that were rendered via the fiddle.
You can see in this trivial example that I can’t get the username element
unless I switch the frame:
There are so many awesome options buried in the Chrome developer tools. Some of them you will rarely use, but when you need them you’ll be glad they’re there!